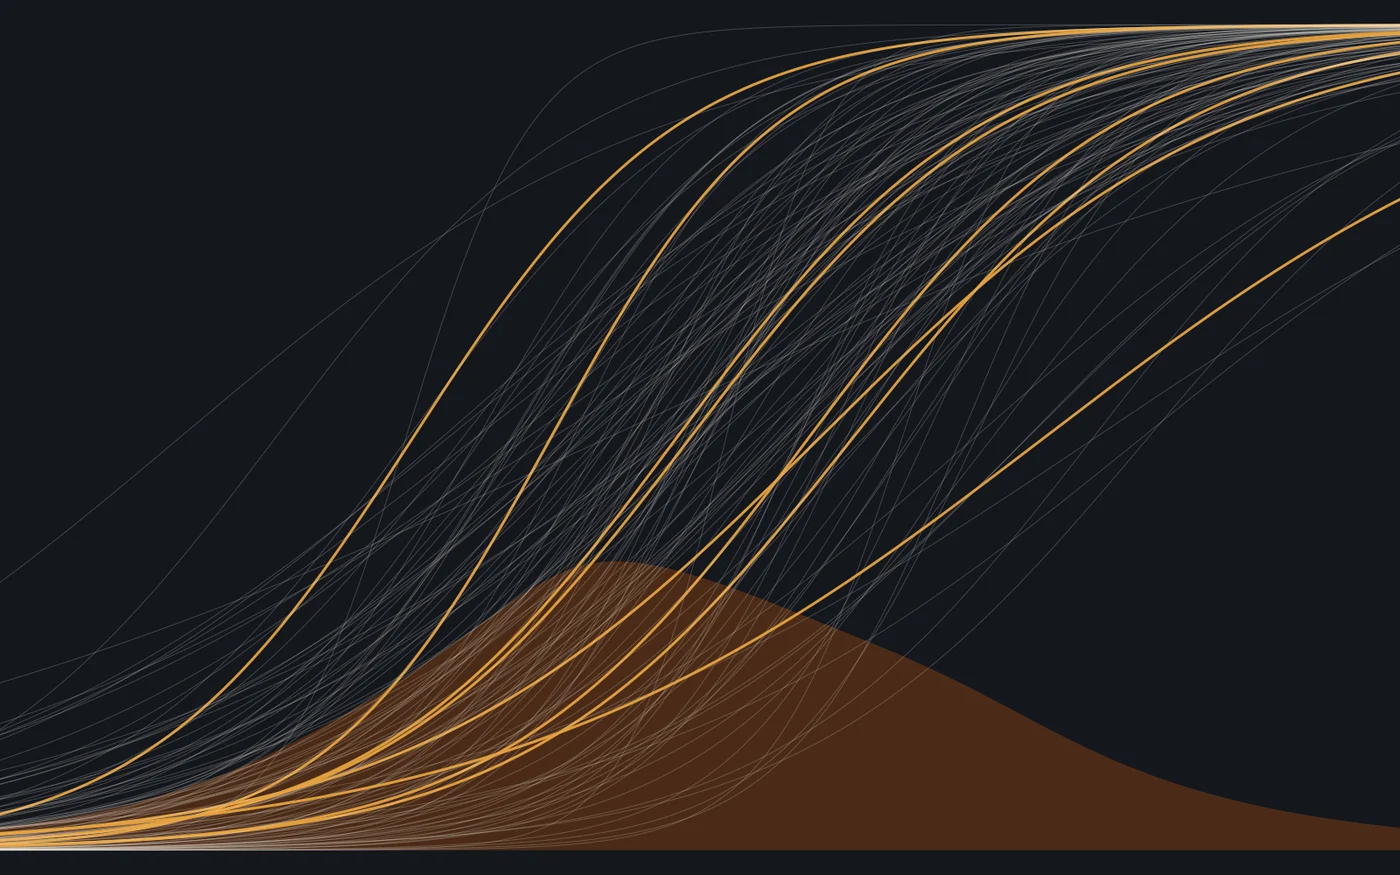
Every claim AI Work Lab wants to make eventually depends on one measurement: whether an engineer understands a piece of code. The obvious instrument, a quiz scored as percent correct, has a defect that becomes fatal in a longitudinal study. Its scale is defined by the questions. Change the questions, as you must when you test the same person every month, and a score of 70% no longer means what it meant last time.
Item response theory fixes this by modelling each question separately and putting people and questions on one scale. The cost is a calibration step, and a calibration sample we do not yet have. So we did the work in the order a careful lab should: specify the model, the design, the scoring, the adaptive algorithm and the fairness checks, then run the whole pipeline on simulated engineers whose true ability is known, and only then write questions for real ones. This report is that rehearsal. It contains no data from people.
A simulation study of a measurement design. Every number below comes from engineers and items generated by the scripts listed under Artefacts. Item parameters were drawn to resemble published programming-assessment banks; they are not estimates from any real test.
The model
Each item j is a short task about a real diff: predict the output, find the line that fails under a given input, say what changes if a condition is flipped. A response is right or wrong. The 2PL model gives the probability that an engineer with ability θ answers correctly as
where bj is the item’s difficulty, the ability at which the chance of success is one half, and aj its discrimination, how sharply it separates engineers just below that point from those just above. The information an item provides about θ, and so how much it reduces uncertainty, is
which peaks at θ = bj and scales with the square of discrimination. Test information is the sum over the items administered, and the standard error of an ability estimate is roughly its inverse square root. Everything that follows, from booklet design to adaptive testing, is an exercise in putting information where it is needed.
We chose the 2PL over the three-parameter model because our items are open-response, so guessing is negligible, and over the Rasch model because items about real code will differ in how cleanly they separate engineers. A multidimensional model with one dimension per concept domain is the natural extension once there is enough data to support it.
Calibration from a planned-missing design
No engineer will answer 120 questions. Instead the bank is split into 16 blocks of seven or eight items, and each of eight booklets combines four blocks, so that every block appears in two booklets and every pair of booklets is linked through shared blocks. Each engineer answers one booklet of about 30 items. Responses to unseen items are missing by design, which is ignorable for likelihood-based estimation.
Item parameters are estimated by marginal maximum likelihood, integrating ability out against a standard normal prior with the EM algorithm of Bock and Aitkin. On a 41-point quadrature grid q1, ..., q41 with weights wk, the E-step computes each engineer’s posterior over the grid and accumulates expected counts:
and the M-step maximises, item by item, the expected complete-data log-likelihood Σk [ r̄jk log Pj(qk) + (n̄jk − r̄jk) log(1 − Pj(qk)) ] with weak priors on log a and b. We use Fisher scoring rather than Newton steps in the M-step; the observed Hessian includes a term that is not negative definite far from the optimum, and in our first implementation Newton steps drove discriminations to their lower bound. The expected Hessian has no such term. Convergence took 32 EM iterations.
With 1,200 respondents, about 300 responses per item, the RMSE is 0.22 for discrimination and 0.19 for difficulty, on a scale where item difficulties have a standard deviation of 1. With 600 respondents it is 0.29 and 0.25; with 2,400, 0.17 and 0.14. We set 1,200 as the calibration target: below it, error in item parameters starts to compete with error in ability estimates, and the gain from going higher is modest.
Scoring: why percent correct is not good enough
Once items are calibrated, an engineer’s ability is estimated by its posterior mean (EAP), the expected value of θ over the posterior given their responses:
The decisive test is alternate forms: give the same 500 simulated engineers two different booklets and ask how well the two scores agree. Percent correct agrees at 0.83; EAP at 0.87. The mean absolute gap between an engineer’s two scores, in standard deviations of the score, is 0.46 for percent correct and 0.41 for EAP. The improvement is real but modest at this booklet length, because the booklets were built to be balanced. It grows with every month a longitudinal study runs, since each month’s booklet will differ from the last by more than ours do from each other, and percent correct cannot correct for a harder month.
Adaptive testing
A fixed booklet wastes questions: a strong engineer answers easy items that tell us nothing, a struggling one answers hard items that tell us nothing either. A computerised adaptive test (CAT) chooses each next item to maximise information (2) at the current ability estimate, updates the posterior, and stops when the posterior standard deviation falls below a target or 40 items have been given.
| Design | Mean items | RMSE of ability | RMSE where |θ| > 1.5 |
|---|---|---|---|
| Adaptive, stop at SE 0.40 | 10.8 | 0.42 | · |
| Adaptive, stop at SE 0.35 | 15.3 | 0.37 | · |
| Adaptive, stop at SE 0.30 | 22.9 | 0.34 | 0.41 |
| Adaptive, stop at SE 0.25 | 36.0 | 0.28 | · |
| Fixed: best 30 items at the mean | 30 | 0.32 | 0.50 |
| Fixed: random 30 items | 30 | 0.36 | 0.52 |
| Fixed: random 15 items | 15 | 0.51 | 0.67 |
An adaptive test stopping at a standard error of 0.30 matches the accuracy of the best fixed 30-item form with 23 items on average, and is clearly better for engineers far from the mean (tail RMSE 0.41 against 0.50), where the fixed form’s information runs out. Stopping at 0.40 needs only 11 items and is still more accurate than a random 15-item form. For a monthly assessment inside a working week, that difference between 30 questions and 11 is the difference between a study engineers tolerate and one they quietly stop doing.
Exposure
Pure maximum-information selection has a cost that matters for a test given repeatedly to the same people: it reuses the same few highly discriminating items. Engineers talk, and an item everyone has seen measures memory, not comprehension.
| Selection rule (SE 0.30 stop) | Mean items | RMSE | Most-exposed item | Items shown to over half | Items never used |
|---|---|---|---|---|---|
| Maximum information | 22.5 | 0.32 | 100% | 16 | 21 |
| Randomesque, top 5 | 23.0 | 0.33 | 89% | 16 | 18 |
| Randomesque, top 15 | 25.1 | 0.32 | 73% | 17 | 3 |
Randomesque selection from the fifteen best candidates costs about two extra items, does not hurt accuracy, cuts the most-exposed item from every test-taker to 73% and brings 18 unused items back into circulation. It does not reduce the core of 16 or 17 items seen by more than half of engineers. That needs a formal exposure ceiling in the style of Sympson and Hetter, and more good items in the middle of the scale, which is what we will write next.
Fairness: items that behave differently by language background
An item about a Python diff may be harder for an engineer who works mostly in Java for reasons unrelated to comprehension. That is differential item functioning (DIF): at equal ability, the probability of success differs by group. We simulate eight biased items, two each with a difficulty shift of 0.25, 0.4, 0.6 and 0.8 logits for a focal group making up 35% of respondents, re-drawn every replicate so that results average over item characteristics.
We screen with the Mantel-Haenszel procedure: stratify engineers by their score on the remaining items, and within each stratum s compare the odds of success in the reference and focal groups. With As, Bs the reference group’s correct and incorrect counts and Cs, Ds the focal group’s:
An item is flagged if |ΔMH| ≥ 1 and the continuity-corrected MH chi-square is significant at 5%, which is the ETS rule for moderate or large DIF.
Detection depends heavily on sample size, because in a booklet design each item is seen by only a quarter of respondents and the focal group is a third of those. At 600 respondents only 28% of large (0.8-logit) biases are caught; at 2,400, 79%. Moderate biases of 0.4 logits are caught a third of the time even at 2,400. The false-positive rate stays near 3% throughout. The practical conclusion is uncomfortable: at the sample sizes a startup can reach in its first year, statistical DIF screening will miss most bias it should catch, so it must be backed by review. Every item will be read by engineers from at least two language backgrounds before it enters the bank, and items will be written in a language-neutral pseudocode where the concept allows, following the approach of the language-independent CS1 assessments.
The plan this sets
- Write 160 items across six concept domains, expecting to retire a quarter at review or calibration.
- Calibrate on at least 1,200 engineers in a booklet design, with each item seen by about 300.
- Score by EAP, never percent correct, and report every score with its standard error.
- Use an adaptive test stopping at SE 0.35 for monthly measurement (about 15 items), with randomesque selection from the top 15 and an exposure ceiling.
- Screen for DIF by language background and seniority at every recalibration, and treat a non-flag as weak evidence.
Method
Limitations
Simulated engineers answer exactly as the model says they will, so this study cannot reveal misfit, which is the most common way real calibrations fail. Comprehension is almost certainly not unidimensional: an engineer can read concurrency code well and error-handling code badly, and a single θ will average over that. Items about real diffs are also not locally independent when several are drawn from the same diff. Finally, all of this assumes the trait is stable within a test session, while our eventual interest is in how it changes month to month, which needs a longitudinal model on top of the measurement model.
Simulation only. No engineer has taken this test. Code, parameters and seeds are listed under Artefacts.
Related work
The 2PL model is Birnbaum’s [1], and Lord [2] and Embretson and Reise [3] are the standard references for its use. Marginal maximum likelihood estimation by EM is Bock and Aitkin [4]; EAP scoring is Bock and Mislevy [5]. Adaptive testing follows van der Linden and Glas [6]; randomesque selection is Kingsbury and Zara [7], and Sympson and Hetter [8] is the exposure-control method we plan to adopt. Mantel-Haenszel DIF screening is Holland and Thayer [9], with the ETS classification reviewed by Zwick [10]. In computing education, Lister and colleagues [11] showed that tracing and reading are separable from writing, which motivates our item types, and Tew and Guzdial [12] and Parker and colleagues [13] built and validated language-independent assessments, which is the route we take to reduce language-background bias at source.
Artefacts
Everything below is published or available on request. A number nobody can reproduce is an advertisement, not a result.
References
- Birnbaum, A. (1968). Some Latent Trait Models and Their Use in Inferring an Examinee’s Ability. In Lord, F. M., & Novick, M. R., Statistical Theories of Mental Test Scores. Addison-Wesley.
- Lord, F. M. (1980). Applications of Item Response Theory to Practical Testing Problems. Lawrence Erlbaum.
- Embretson, S. E., & Reise, S. P. (2000). Item Response Theory for Psychologists. Lawrence Erlbaum.
- Bock, R. D., & Aitkin, M. (1981). Marginal Maximum Likelihood Estimation of Item Parameters: Application of an EM Algorithm. Psychometrika, 46(4).
- Bock, R. D., & Mislevy, R. J. (1982). Adaptive EAP Estimation of Ability in a Microcomputer Environment. Applied Psychological Measurement, 6(4).
- van der Linden, W. J., & Glas, C. A. W. (Eds.) (2010). Elements of Adaptive Testing. Springer.
- Kingsbury, G. G., & Zara, A. R. (1989). Procedures for Selecting Items for Computerized Adaptive Tests. Applied Measurement in Education, 2(4).
- Sympson, J. B., & Hetter, R. D. (1985). Controlling Item-Exposure Rates in Computerized Adaptive Testing. Proceedings of the 27th Annual Meeting of the Military Testing Association.
- Holland, P. W., & Thayer, D. T. (1988). Differential Item Performance and the Mantel-Haenszel Procedure. In Wainer, H., & Braun, H. I. (Eds.), Test Validity. Lawrence Erlbaum.
- Zwick, R. (2012). A Review of ETS Differential Item Functioning Assessment Procedures. ETS Research Report RR-12-08.
- Lister, R., Adams, E. S., Fitzgerald, S., et al. (2004). A Multi-National Study of Reading and Tracing Skills in Novice Programmers. ITiCSE Working Group Reports.
- Tew, A. E., & Guzdial, M. (2011). The FCS1: A Language Independent Assessment of CS1 Knowledge. SIGCSE.
- Parker, M. C., Guzdial, M., & Engleman, S. (2016). Replication, Validation, and Use of a Language Independent CS1 Knowledge Assessment. ICER.
Bhardwaj, M. (2023). An item bank for code comprehension: calibration, adaptive testing and fairness checks with item response theory. AI Work Lab Research, AWL-2023-01.