Agent leaderboards changed shape over the past year. SWE-bench made the unit of evaluation a real issue in a real repository, SWE-bench Verified in August cut it to 500 tasks that human annotators confirmed are solvable, and every week brings a new scaffold, model or prompt reporting a resolve rate a point or two above the last. Most of those numbers come from a single run.
We care because our product has to work with whichever agent an engineer uses, and because the evaluations we plan of how agents interact with our comprehension checks will have the same structure: a few hundred tasks, an expensive run, and a strong temptation to run it once. In our pass@k study last year we showed how little a small code benchmark can separate. Agents add a second source of noise that single-shot code generation lacks: a long, stateful trajectory in which an early tool failure, a timeout or a slightly different file listing sends the run somewhere else. This paper measures, in simulation, what that does to the comparisons people are making.
A simulation study. The four configurations are synthetic and are not stand-ins for any named agent or model. Parameters were chosen so that single-configuration behaviour (resolve rates in the 30s, pass@5 in the 50s) resembles what public leaderboards and agent papers report this year.
A model of an agent run
Task j has a latent difficulty dj ~ N(0, 2²). Configuration a has a skill sa, a consistency (sharpness) κa, and a task-specific affinity ηaj ~ N(0, 0.8²) capturing the fact that agents built differently fail on different issues. Run r of configuration a carries a shock δar ~ N(0, 0.15²) shared by every task in that run. The task is resolved with probability
with harness failure rate f = 0.02. Skill is calibrated once, against 200,000 reference tasks, so that each configuration’s population resolve rate hits its target; any particular 500-task benchmark then lands a little above or below it. Configurations A, B and C have κ = 2.2 and targets of 33%, 35.5% and 38%. D has the same 38% target as C but κ = 1.0, so it is less consistent from run to run.
Three estimands are in play, and conflating them causes most of the trouble. The run estimand is this configuration’s expected score on these 500 tasks; its uncertainty comes from runs. The population estimand is its expected score on the population of issues the benchmark represents; its uncertainty also comes from which tasks were sampled. The reliability estimand is the share of tasks the configuration solves every time, which is what an engineer handing it a ticket actually experiences.
Result 1: the same agent, five times
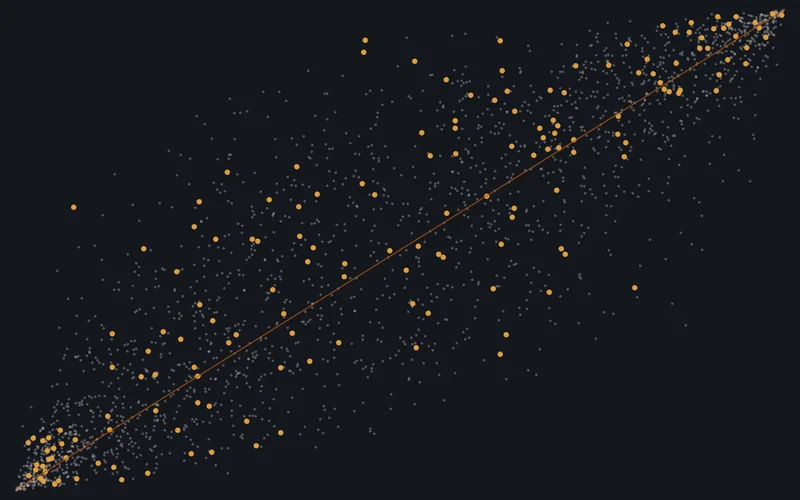
Five runs of C on identical tasks gave 38.8%, 40.0%, 37.0%, 36.6% and 37.4%. Across 2,000 simulated runs the standard deviation was 1.7 points and the central 95% range ran from 34.8% to 41.4%. Any single reported number could sit anywhere in that interval, and a leaderboard sorted on single runs will reorder itself every time anyone reruns it.
Redrawing the 500 tasks from the same population contributes a further 1.8 points, so a single run’s total standard deviation as an estimate of population capability is 2.4 points. Unlike single-shot code generation, where we found problem sampling dominant, run noise and task noise are of similar size for agents, so both need to be in the interval.
Result 2: the binomial interval is right for neither estimand
The interval most often attached to a resolve rate, when one is attached at all, is binomial: p̂ ± 1.96√(p̂(1 − p̂)/500).
| Interval | Covers the run estimand | Covers the population estimand |
|---|---|---|
| Binomial, one run | 99.3% | 90.7% |
| Bootstrap over five runs | 83.0% | · |
| Two-level bootstrap: tasks, then five runs | · | 96.3% |
For the run estimand the binomial interval is too wide, because the per-task resolve probabilities are spread toward 0 and 1, so Σ pj(1 − pj) is much smaller than n p̄(1 − p̄). For the population estimand it would be exactly right if tasks were the only noise (by the law of total variance a single run is then a binomial draw from the population rate), but the run-level shock adds variance the formula does not see, and coverage falls to 91%. Bootstrapping five runs alone is too narrow for the opposite reason: five values are not enough to estimate a variance. A two-level bootstrap, resampling tasks and then runs within the resampled tasks, covers the population rate at 96%:
Result 3: comparisons need runs, and a test that knows about them
With one run each, B beats or ties C 17% of the time. Three runs cut that to 8% and five to 5%; ten runs still leave 3%, a floor set by which tasks happen to be in the benchmark. The paired test detects the gap only 27% of the time from single runs and 57% from ten. Configurations A, B and C appear in the correct order from single runs 63% of the time.
The more worrying result is what happens when there is no difference at all. We evaluated C against an identical twin.
From single runs, a test paired over tasks rejects 11% of the time. Pairing removes task difficulty from the comparison, which is why it is the right instinct, but it treats the 500 tasks within a run as independent, and the run-level shock makes them move together. The unpaired binomial test is conservative at one run (2%) and becomes badly anticonservative as runs are pooled, reaching 15% at ten, because it counts 5,000 correlated outcomes as independent evidence. With five or more runs the paired test is closer to nominal (8%) but not there. The defensible procedure is to treat the run as the unit for the run-level variance component: compute the paired difference within each run, and use the between-run spread of those differences, or the two-level bootstrap in (2), for the interval.
If two agent configurations are within about 2.5 points and each was run once, the difference is not evidence of anything. Five runs each, with run-aware intervals, is the minimum for a claim we would publish.
Result 4: equal pass@1, very different agents
Configurations C and D have the same population resolve rate. They are not the same agent for an engineer.
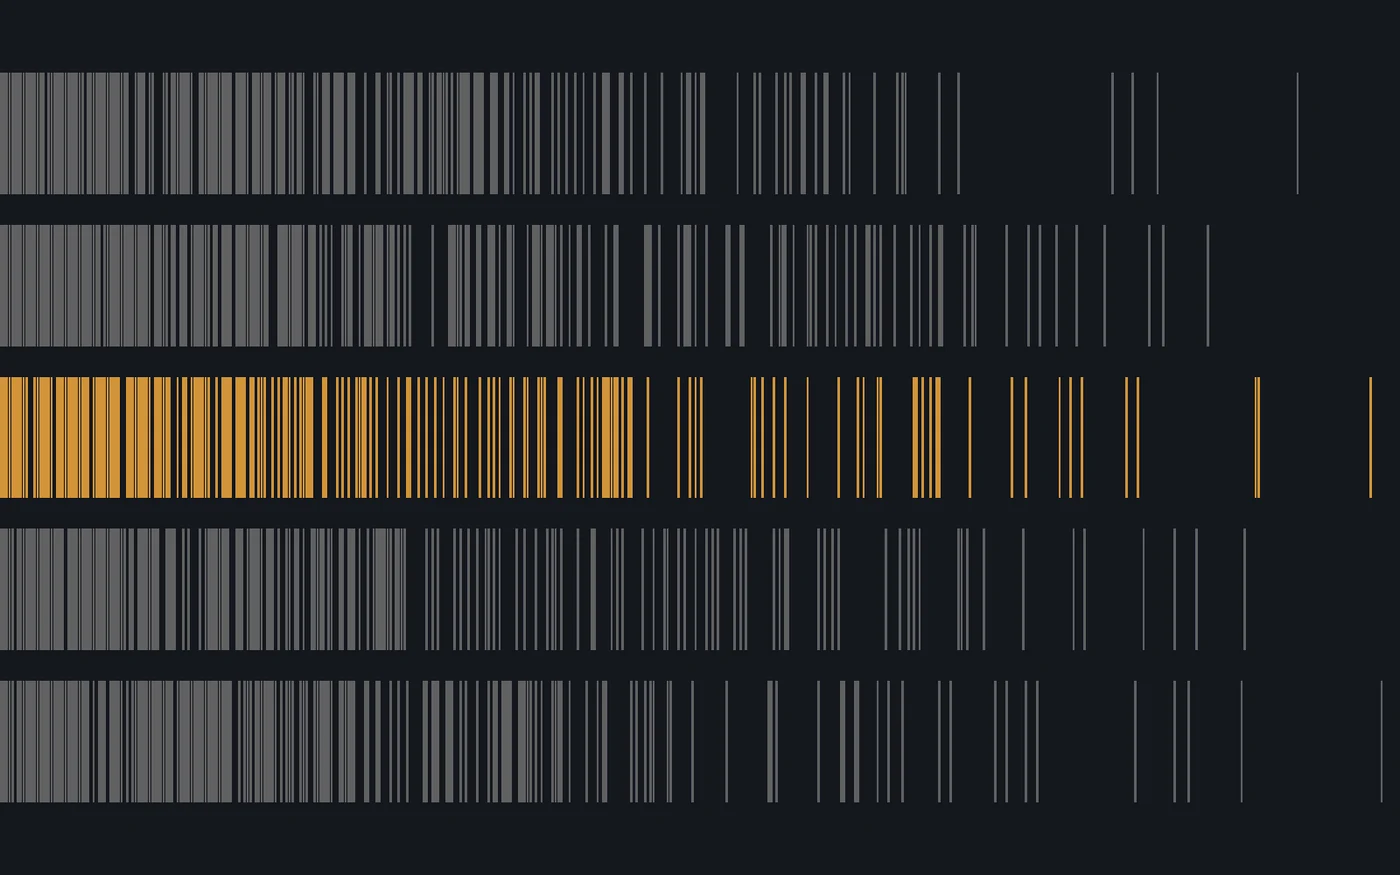
D, the less consistent configuration, solves at least once in five runs 68% of tasks against C’s 54%, and leaves only 32% never solved against 46%. But it solves only 11% of tasks on every run, against C’s 21%. Which is better depends on how it is used. As a generator whose candidates are filtered by tests, D is far stronger. As a colleague you hand a ticket to once, C is twice as dependable. Yao and colleagues introduced pass^k in τ-bench this summer for exactly this reason. A leaderboard of pass@1 hides the distinction entirely.
How many runs
| Runs of each configuration | SD of the difference, fixed tasks (points) |
|---|---|
| 1 | 2.32 |
| 2 | 1.71 |
| 3 | 1.28 |
| 5 | 0.98 |
| 8 | 0.89 |
| 10 | 0.74 |
| 15 | 0.66 |
The run-to-run standard deviation of a difference falls roughly as one over the square root of the number of runs, from 2.3 points at one run to 1.0 at five. Past five, the returns diminish quickly relative to cost, and the task-sampling floor, which more runs cannot touch, starts to dominate. Five runs per configuration is the default we recommend.
What we recommend reporting
- Five runs per configuration, with run seeds and dates, and the per-run scores, not just their mean.
- Two-level bootstrap intervals for population claims; within-run paired differences with between-run variance for comparisons.
- pass@1, pass@5 and pass^5 together. They answer different questions.
- Harness failures counted and reported separately, not silently scored as unresolved.
- Cost per resolved task alongside every rate, following Kapoor and colleagues: a configuration that wins by sampling more is not the same as one that wins by reasoning better.
Method
Limitations
Real agent failures are more structured than a logistic model with one shock per run: a provider outage can wipe out a contiguous block of tasks, and some tasks fail for environment reasons on every run. Both would increase the variance we report. We modelled tasks as independent within the benchmark, while repository-level benchmarks draw many tasks from each repository, which adds the clustering penalty we described in AWL-2023-02. We did not model the cost of runs, which in practice is what decides how many there are. Finally, the sharpness parameter is a crude stand-in for consistency; real agents may be consistent on some task types and erratic on others.
Simulation only. No agent or model was run for this paper. The script, seeds and results file are under Artefacts.
Related work
SWE-bench is Jimenez and colleagues [1], and the 500-task Verified subset was released by OpenAI with the original authors in August [2]. Agent scaffolds of the kind we model include SWE-agent [3], OpenDevin [4] and Agentless [5], which showed that a deliberately simple pipeline can be competitive with elaborate agents, a reminder that scaffold choices matter as much as model choice. pass^k is from τ-bench [6]. Madaan and colleagues [7] quantified seed variance across language-model benchmarks, and Kapoor and colleagues [8] argued that agent evaluations must report cost and repeated-run variance; our results put numbers on the second argument for repository-level tasks. Bouthillier and colleagues [9] decompose benchmark variance into sources. The two-level bootstrap follows Davison and Hinkley [10] and Field and Welsh [11]. Our earlier work on code-generation leaderboards is AWL-2023-02 [12].
Artefacts
Everything below is published or available on request. A number nobody can reproduce is an advertisement, not a result.
References
- Jimenez, C. E., Yang, J., Wettig, A., Yao, S., Pei, K., Press, O., & Narasimhan, K. (2024). SWE-bench: Can Language Models Resolve Real-World GitHub Issues? ICLR.
- Chowdhury, N., Aung, J., Shern, C. J., et al. (2024). Introducing SWE-bench Verified. OpenAI, 13 August 2024.
- Yang, J., Jimenez, C. E., Wettig, A., Lieret, K., Yao, S., Narasimhan, K., & Press, O. (2024). SWE-agent: Agent-Computer Interfaces Enable Automated Software Engineering. arXiv:2405.15793.
- Wang, X., Li, B., Song, Y., et al. (2024). OpenDevin: An Open Platform for AI Software Developers as Generalist Agents. arXiv:2407.16741.
- Xia, C. S., Deng, Y., Dunn, S., & Zhang, L. (2024). Agentless: Demystifying LLM-based Software Engineering Agents. arXiv:2407.01489.
- Yao, S., Shinn, N., Razavi, P., & Narasimhan, K. (2024). τ-bench: A Benchmark for Tool-Agent-User Interaction in Real-World Domains. arXiv:2406.12045.
- Madaan, L., Singh, A. K., Schaeffer, R., et al. (2024). Quantifying Variance in Evaluation Benchmarks. arXiv:2406.10229.
- Kapoor, S., Stroebl, B., Siegel, Z. S., Nadgir, N., & Narayanan, A. (2024). AI Agents That Matter. arXiv:2407.01502.
- Bouthillier, X., Delaunay, P., Bronzi, M., et al. (2021). Accounting for Variance in Machine Learning Benchmarks. MLSys.
- Davison, A. C., & Hinkley, D. V. (1997). Bootstrap Methods and Their Application. Cambridge University Press.
- Field, C. A., & Welsh, A. H. (2007). Bootstrapping Clustered Data. Journal of the Royal Statistical Society, Series B, 69(3).
- Bhardwaj, M. (2023). Pass@k is not a ranking: the statistics of code-model leaderboards. AI Work Lab Research, AWL-2023-02.
Bhardwaj, M. (2024). One run is an anecdote: variance in repository-level agent evaluations. AI Work Lab Research, AWL-2024-02.